What Does Continuing Growth Look Like
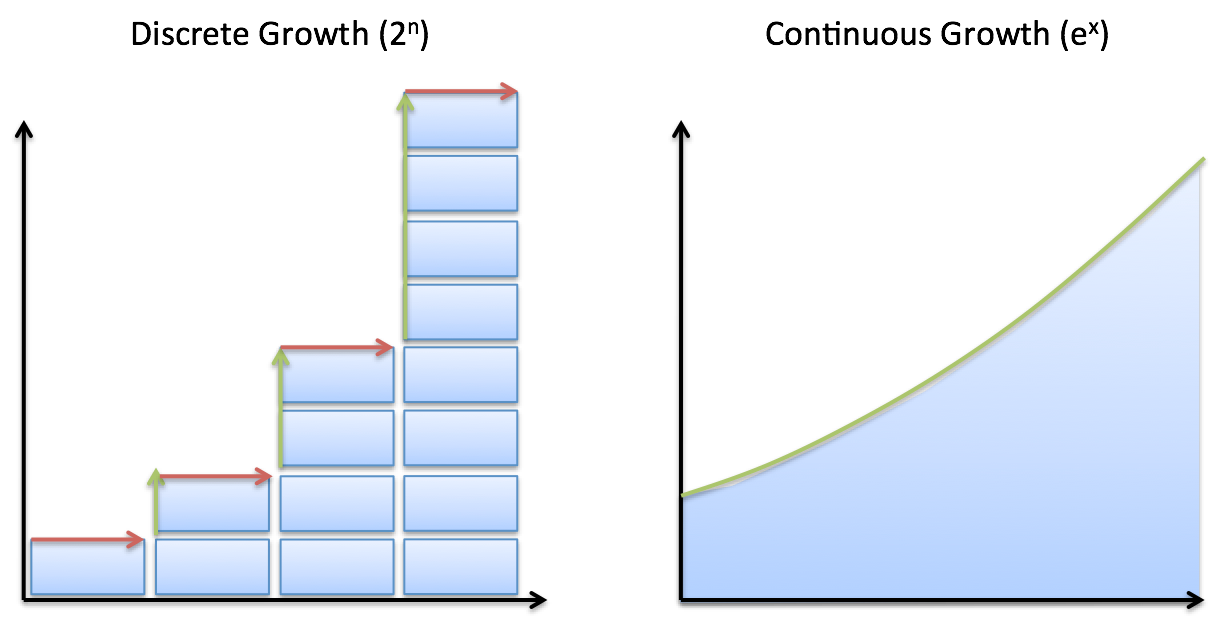
There are two types of exponential growth, and it's easy to mix them up:
- Discrete growth: change happens at specific intervals
- Continuous growth: change happens at every instant
Here's the difference:

The key question: When does growth happen?
With discrete growth, we can see change happening after a specific event. We flip a coin and get new possibilities. We have a yearly interest payment. A mating season finishes and offspring are born.
With continuous growth, change is always happening. We can't point to an event and say "It changed here". The pattern is always in motion (radioactive decay, a bacteria colony, or perfectly compounded interest).
(Brush up on the number e and the natural logarithm.)
Insight: Convert between discrete and continuous
I visualize change as events along a timeline:

Discrete changes happen as distinct green blobs. We can take them, split them into smaller, more frequent changes, and spread them out. With enough splits, we could have smooth, continuous change.
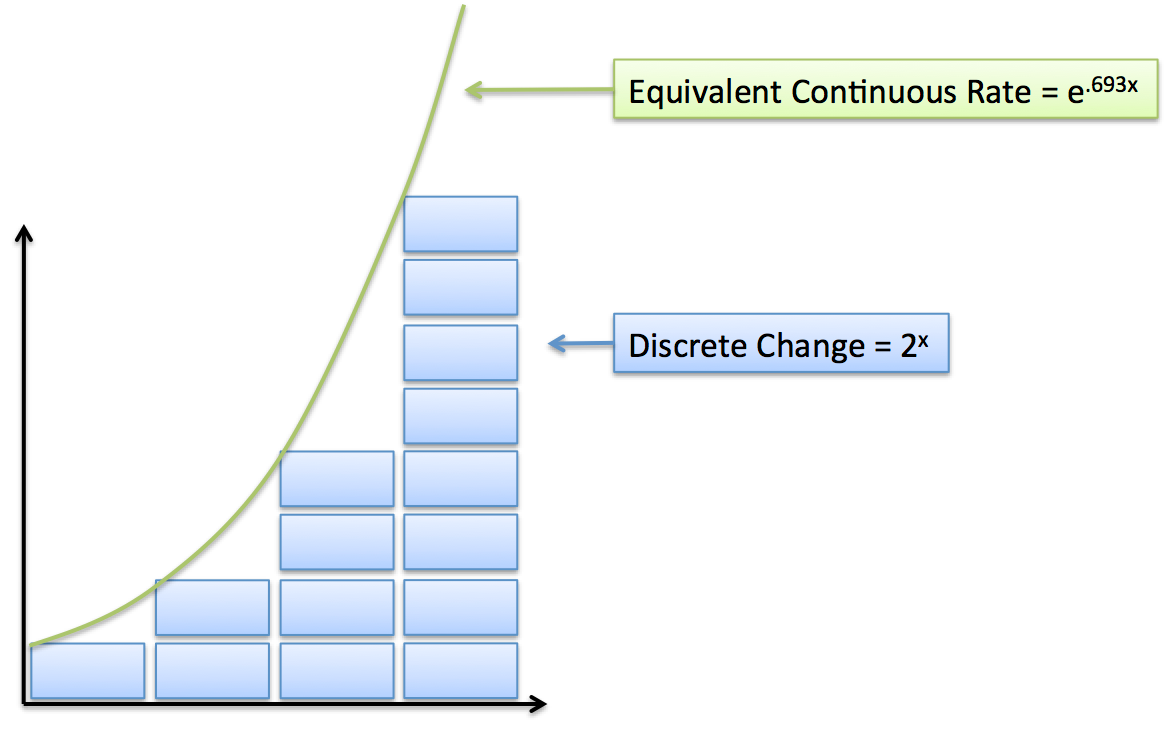
So, discrete changes can be modeled by some equivalent, smooth curve. What does it look like?

The natural log finds the continuous rate behind a result. In our case, we grew from 1 to 2, which means our continuous growth rate was ln(2/1) = .693 = 69.3%. The natural log works on the ratio between the new and old value: $\frac{\text{new}}{\text{old}}$.
Mathematically,
![]()
In other words: 100% discrete growth (doubling every period) has the same effect as 69.3% continuous growth. (Continuous growth requires a smaller rate because of compounding.)
So which version do we use?
Now here's the question: how should we talk about growth? It depends on the scenario:
- If growth happens in a man-made system, discrete growth works better ($2^x$, $3^x$)
- If growth occurs a natural system, continuous growth is better ($e^x$)
Let's take a look.
Example: Flipping Coins
Let's say we flip a coin. What are the possible outcomes?
- 1 flip: 2 outcomes (H or T)
- 2 flips: 4 outcomes (HH, HT, TH, TT)
- 3 flips: 8 outcomes (HHH, HHT, HTH, HTT, THH, THT, TTH, TTT)
You see where this is going. I'd describe the number of possibilities as $2^n$ where n was the number of flips.
I'm using "n" (not x) by convention: x could mean any value on the x-axis (-3, 1.234, $\sqrt{14}$), while n represents an integer (1, 2, 3, 4).
Could we say the number of outcomes was $e^{\ln(2)x}$, where x was the number of coin flips? Yes. But it's confusing: in a man-made system, where we have change events, I'd use the discrete version to describe the possibilities.
Example: Binary Numbers
Binary numbers follow the same pattern: if we have n bits, we get $2^n$ possibilities. For example, 8 bits have 256 possible values, and 16 bits have 65536.
(There may be some cases where intermediate values make sense, like representing the number of bits required, even though we need a whole number of bits in practice. This is similar to saying the average family has 2.3 kids.)
Example: Radioactive Decay
When radioactive material decays, we often talk about its half-life: how long until half the material is gone?
For example, the half-life of Carbon-14 is 5700 years. We could write it like this:
![]()
If we wait 5700 years, we expect $(1/2)^1= .50$ of the carbon remaining. If we double that and wait 11,400 years, we'd expect $(1/2)^2 = .25$ of the carbon left.
However, this equation is written for our convenience. Carbon doesn't decay in jumps, politely waiting around 5700 years and suddenly decaying by half. We use (1/2) as the base because we humans want to count the number of halvings (decaying into half, decaying into a quarter, decaying into an eighth...).
The radioactive material is changing every instant. From a physics perspective, a continuous rate is more telling. We can find the continuous decay rate by converting the discrete growth into a continuous pattern:
![]()
This helps me understand why the natural log is natural -- it's describing what nature is doing on an instant-by-instant basis. None of this "wait until we decay by 50% so humans can count it easier" nonsense.
In practice, you don't discover the half-life by waiting for carbon to decay 50%. You'd wait a reasonable about of time (a year?), use the natural log to find the continuous rate over that period, and work out the half life.
Example: Material X decayed from 53kg to 37kg over 9 months. What's the continuous decay rate and half life (in years)?
The ratio between new and old was 37/53, so ln(37/53) = -.359 = -35.9% continuous growth over our time period. This happened over 9 months, so the monthly continuous rate is -35.9/9 = -3.98%. Scaling this up, the yearly continuous rate is -3.98% * 12 = -47.9%. (Notice how the rate must be scaled to match the time period. Earning "12% interest" isn't helpful without a time period. "12% interest per day" is different than "12% interest per year".)
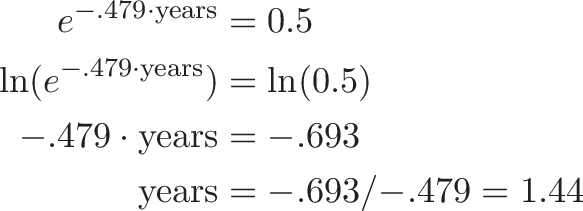
Now that we know the continuous rate is -47.9% per year, we can work out how long until we're at 50%:

The half-life is 1.44 years.
Example: Stock Market Growth
This is a tricky one: the stock market changes every day, so it seems like it'd continuous, but there isn't an underlying predictable rate. We see a lot of jumpy changes, and sample them at yearly intervals to see how we're doing. The market is usually described with an annual average growth rate:
![]()
A continuous rate of the form $e^x$ doesn't really make sense for the system. We aren't trying to model our portfolio's value on a per-instant basis: we want to know what to expect in 30 years.
Example: Population Growth
Population is tricky: depending on the animal, discrete or continuous model can make sense.
A bacteria colony is made of billions of organisms. Although each bacteria cell grows discretely (it has to wait until it splits before splitting again), the entire colony grows smoothly because so many bacteria are in different stages of growth.
Like the radioactive decay example, we can sample the colony at different time periods and work out how long it takes to double. We might have a continuous rate ($e^x$) that expresses the colony's instant rate, and a discrete rate ($2^x$) that helps us humans count the doublings.
One of my pet peeves were problems like "A bacteria colony doubles after 24 hours...". Argh! Are you telling me the bacteria colony just happens to have a continuous rate of precisely ln(2) over the course of a day?
I'd prefer you told me the colony doubled while a grad student stared at a petri dish for 24 hours straight. (1.98kg... 1.99kg... 2.00kg. I found the doubling time, I can go home! What's that Professor? I...ok, I'll work out the continuous rate after an hour next time.)
Rant aside, how about modeling a tiger population? Tigers have breeding seasons. They aren't having kids throughout the year, so the population changes in a discrete event.
![]()
(The model gets more complex as you account for how long it takes for cubs to have children of their own.)
Onward and Upward
I wrote this post because my video on e had questions about how $2^x$ represents "staircase growth". Isn't that a smooth curve too?
Sure, but most of the time we use 2 as a base to model discrete patterns. $2^n$ (where n is an integer) models discrete scenarios like coin flips or binary digits. If your system does change continuously, why not provide the continuous rate and write $e^{\ln(2) x}$?
There's no right and wrong here, just the message we convey. A whole-number base ($2^x$, $3^x$) implies you want people to think about whole-number values of x (and half-life is a good example). Using $e$ as a base ($e^{\text{rate} \cdot \text{time}}$) implies you want people to think about change that happens at every moment.
Either way, be fluent in both models and learn to hop between the two.
Happy math.
Other Posts In This Series
- An Intuitive Guide To Exponential Functions & e
- Demystifying the Natural Logarithm (ln)
- A Visual Guide to Simple, Compound and Continuous Interest Rates
- Common Definitions of e (Colorized)
- Understanding Exponents (Why does 0^0 = 1?)
- Using Logarithms in the Real World
- How To Think With Exponents And Logarithms
- Understanding Discrete vs. Continuous Growth
- What does an exponent really mean?
- Q: Why is e special? (2.718..., not 2, 3.7 or another number?)
Source: https://betterexplained.com/articles/understanding-discrete-vs-continuous-growth/
0 Response to "What Does Continuing Growth Look Like"
Postar um comentário